Generating Documentation
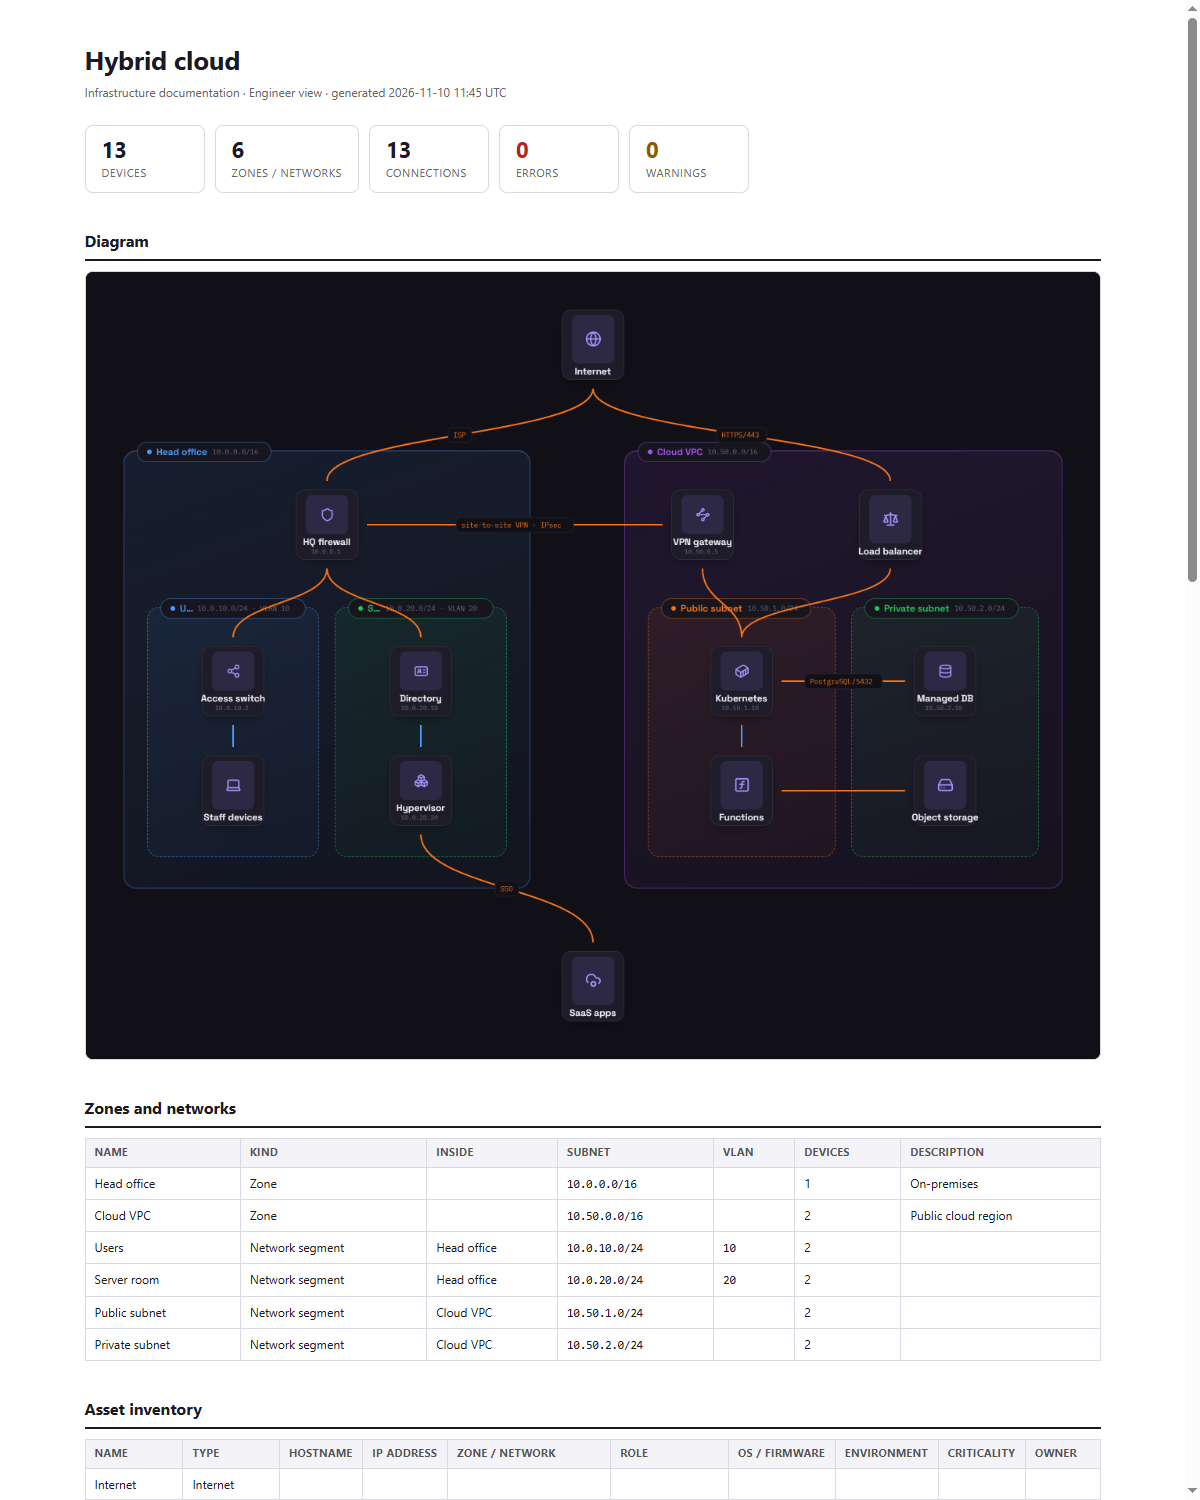
A diagram that carries real data can write its own documentation. From the ribbon’s Export menu, Schema generates a complete write-up of the current view.
What’s in it
Section titled “What’s in it”- Summary — counts of devices, zones and networks, connections, and open errors and warnings.
- The diagram — the whole view as an image (HTML and PDF only).
- Zones and networks — each one with its kind, what it’s nested inside, subnet, VLAN, device count and description.
- Asset inventory — every device with its type, hostname, IP, network, role, OS, environment, criticality and owner, followed by a detail block for any device with more (MAC, vendor, serial, location, management URL, custom fields, notes).
- Connections — every link: from, to, direction, label, protocol and port, and whether it crosses a network boundary.
- Compliance and network findings — every open finding, then the list of rules in force.
It describes whichever view you’re looking at — generate one from Engineer View for the operations runbook and one from Manager View for a summary.
Formats
Section titled “Formats”- Print / save as PDF… — opens your browser’s print dialog on the report. Choose Save as PDF as the printer to get a PDF.
- Report (HTML) — a single self-contained file: styling and the diagram image are embedded, so it can be emailed, attached to a ticket, or archived as-is. It contains no scripts.
- Report (Markdown) — plain Markdown tables, for pasting into a wiki (Confluence, BookStack, GitHub, GitLab) or committing next to your configuration.
Keeping it current
Section titled “Keeping it current”The report is generated from the diagram at the moment you export it. Update the diagram, export again — there’s no second document to maintain.