Network Checks & Diagram Health
Schema understands IP addresses and subnets, so it can catch a class of mistake that’s objectively a mistake whatever your policies are. These checks need no setup — they run on whatever addressing you’ve filled in, and stay silent about anything you haven’t.
What’s checked
Section titled “What’s checked”| Finding | Severity |
|---|---|
| Two devices have the same IP address | Error |
| A device’s IP address is outside the subnet of the segment or zone it’s drawn in | Error |
| An IP address isn’t a valid IPv4 or IPv6 address | Warning |
A segment’s subnet isn’t valid CIDR notation (expected e.g. 10.0.1.0/24) |
Warning |
| A VLAN ID isn’t between 1 and 4094 | Warning |
| Two unrelated segments have overlapping subnets | Warning |
| A nested segment’s subnet isn’t inside its parent’s | Warning |
| Two devices have the same hostname | Warning |
“The subnet it’s drawn in” means the nearest enclosing container that has one: a host inside Web tier (no subnet), itself inside DMZ (10.0.1.0/24), is checked against the DMZ’s.
To use the subnet check, give a zone or segment a subnet in its Properties panel.
One machine drawn in several places
Section titled “One machine drawn in several places”A server that serves several zones is sometimes drawn once in each. Those copies share a hostname and address on purpose, so tick Multi-use machine in the Properties panel of each one: devices marked that way, with the same hostname, are treated as one machine and aren’t reported as duplicates of each other. Each carries a small badge in its top-left corner. A device that isn’t marked and repeats the hostname or address is still reported.
Where findings appear
Section titled “Where findings appear”- On the canvas — a small ! badge on the device or container: red if any finding is an error, amber if they’re all warnings. Hover it to read them.
- In the Properties panel — listed at the top.
- In the Health panel — all of them, in one list.
The Health panel
Section titled “The Health panel”Click Health in the ribbon. The button itself shows a count whenever there’s anything open.
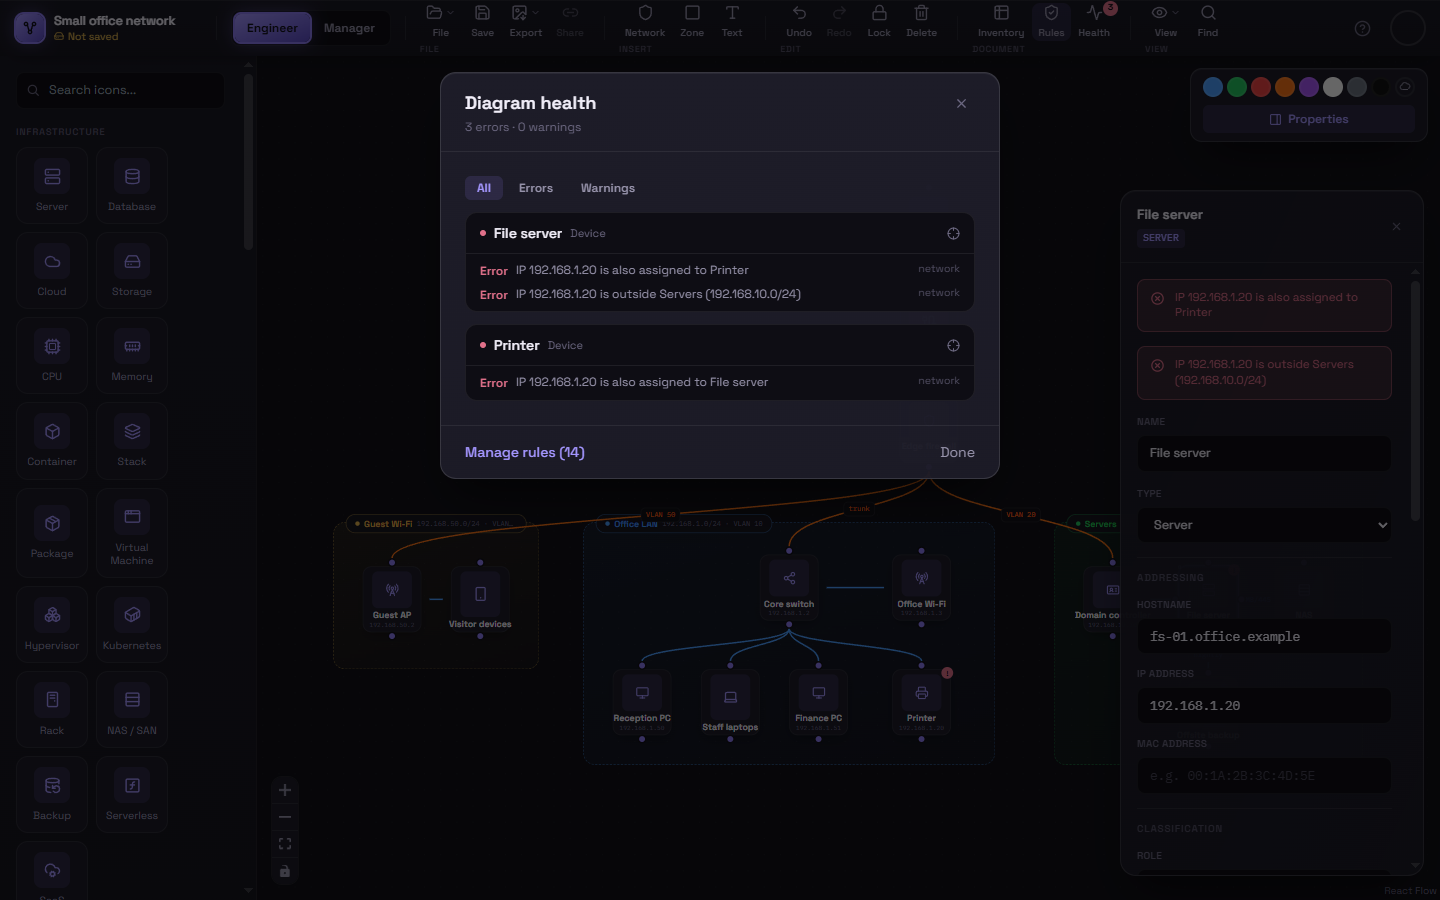
The panel lists every finding in the current view, grouped by the device or network it’s about, errors first — both these built-in checks and violations of your own compliance rules. Filter to just errors or just warnings, and click any entry to jump to it on the canvas.
A diagram with nothing listed is internally consistent and passes every rule you’ve set.