The Workspace
When you open the app, you land on an empty canvas with three main areas: the ribbon across the top, the icon sidebar on the left, and the canvas filling the rest of the screen.
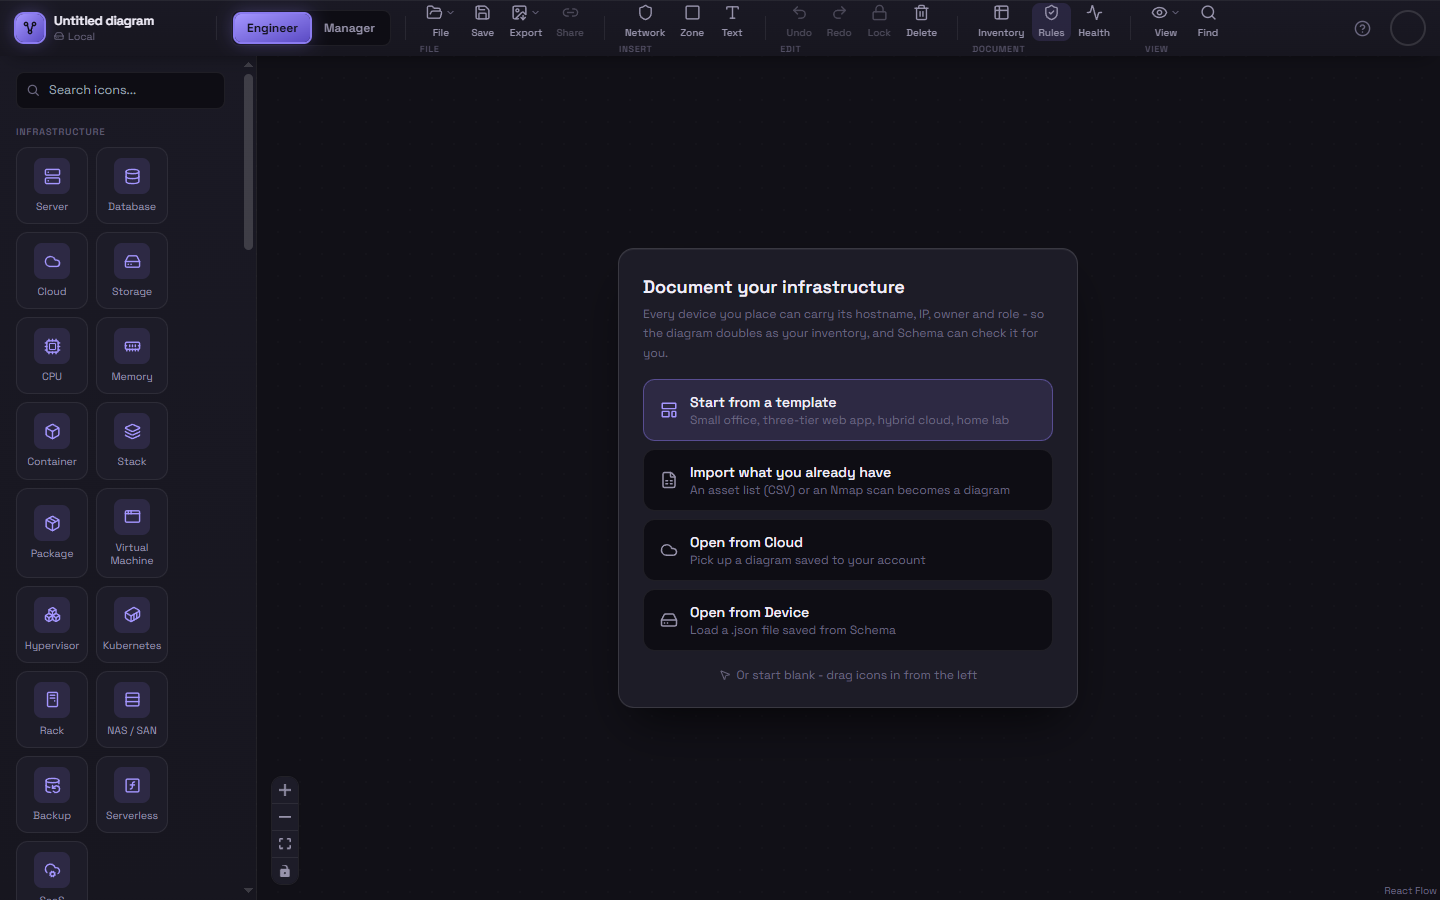
Getting started from an empty canvas
Section titled “Getting started from an empty canvas”An empty canvas offers four ways in:
- Start from a template — a complete, editable example (small office, three-tier web app, hybrid cloud, zero trust access, home lab) with devices, subnets, labelled connections and a matching set of compliance rules.
- Import what you already have — turn an asset spreadsheet or an Nmap scan into a diagram. See Importing Devices.
- Open from Cloud / Open from Device — pick up an existing diagram. See Saving & Opening.
Or ignore the card and start dragging icons in from the sidebar — it disappears as soon as there’s something on the canvas.
The ribbon
Section titled “The ribbon”Every tool in Schema lives in the top ribbon, organized into labeled groups.

| Group | What it does |
|---|---|
| Title & status | The diagram’s name, and whether it’s saved: Saved to cloud, Unsaved changes, Local (not a cloud diagram), and so on. |
| View switcher | Toggle between Engineer View and Manager View — two independent diagrams that live in the same file. |
| File | The File menu (new, open, save a copy, import, merge, version history, your data), a one-click Save, the Export menu, and Share. See Saving & Opening, Exporting and Sharing. |
| Insert | Add a Network Segment, a Zone, or a Text label to the canvas. |
| Edit | Undo, redo, lock or unlock the selection, and delete it. |
| Document | The things that treat the diagram as a record of your infrastructure: the Inventory table, the Compliance Rules editor, and the Health panel listing every open finding. |
| View | The View menu (zoom, show/hide IP addresses, minimap, snap to grid) and Find, which jumps to a device by name, hostname, IP or owner. |
A ? button at the far right opens the keyboard shortcuts and these docs; your account avatar sits beside it.
If the window is narrower than the ribbon, the ribbon scrolls sideways rather than hiding anything.
The sidebar
Section titled “The sidebar”The left sidebar holds the icon library — every infrastructure element you can drag onto the canvas, grouped by category (Infrastructure, Network, Security, Devices, and more), with a search box at the top that matches on name or category.
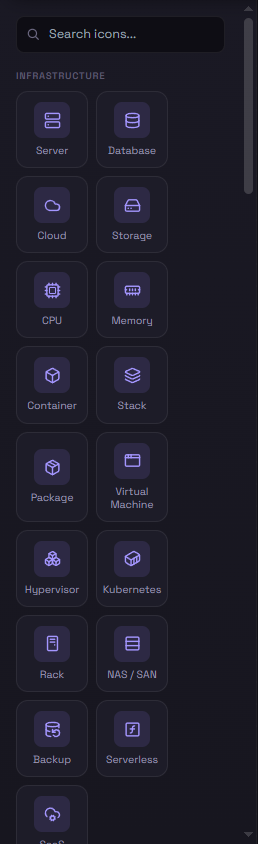
See Adding Nodes for how to actually get these onto the canvas.
The canvas
Section titled “The canvas”The canvas is an infinite, pannable, zoomable surface — click and drag empty space to pan, scroll to zoom, or use the zoom items in the View menu. A floating control cluster in the bottom-left corner offers the same zoom controls plus a lock icon that toggles whether the canvas responds to interaction at all (useful when you just want to look, not edit).
Once you’ve built something, it looks more like this:
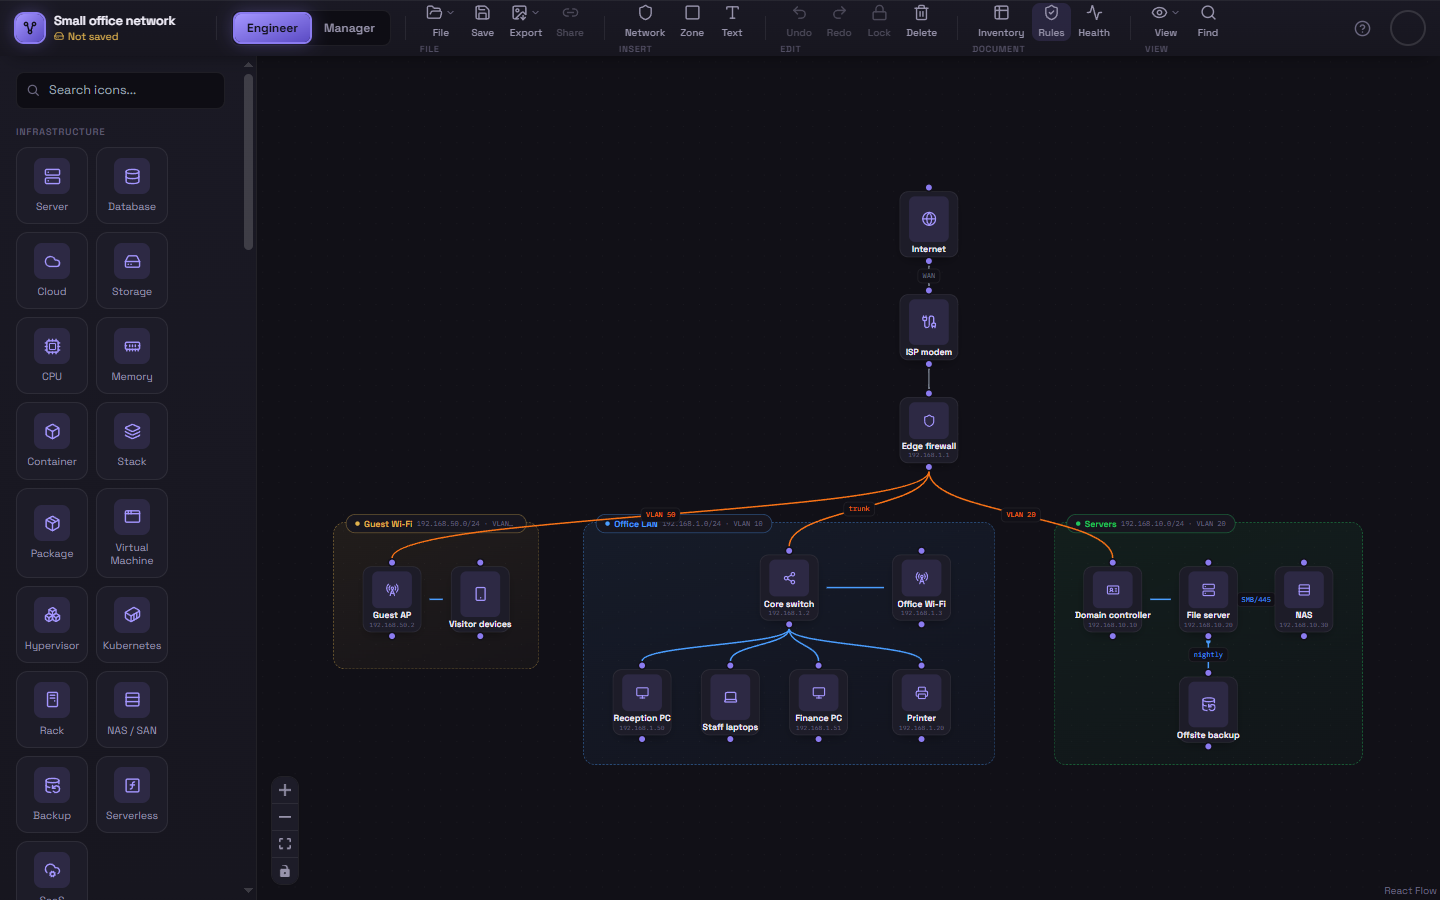
Everything you see there — the dashed network segments with their subnets, the solid zones, the colored and labelled connections, the IP address under each device — is covered in the next few pages.