Edge Styles & Arrows
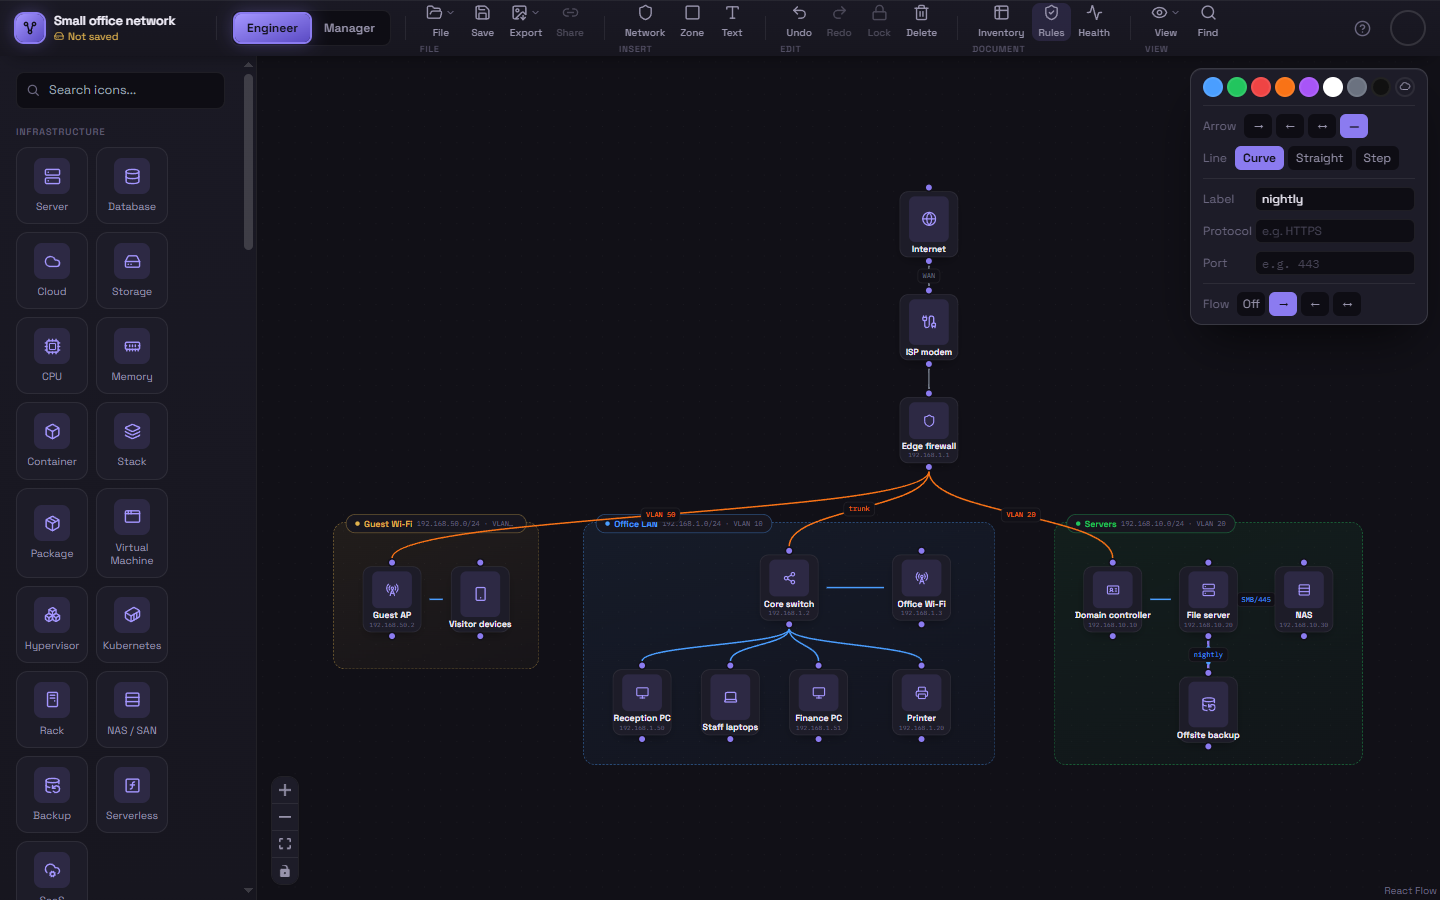
Select any connection and the color toolbar gains extra rows beyond color: Arrow and Line (below), fields to label the connection, and Flow.
Arrow direction
Section titled “Arrow direction”Four options control where arrowheads appear:
| Icon | Meaning |
|---|---|
| → | Arrowhead at the end you drew to (the default) |
| ← | Arrowhead at the end you drew from |
| ↔ | Arrowheads at both ends |
| — | No arrowheads at all |
This is purely about which end(s) get a visible arrowhead — it doesn’t affect data-flow animation direction, which is controlled separately.
Line shape
Section titled “Line shape”Three options control how the connection is drawn between the two nodes:
- Curve — a smooth bezier curve (the default).
- Straight — a direct straight line.
- Step — a right-angled, “circuit board” style path.
There’s no single “best” choice — dense diagrams with lots of crossing connections often read more clearly with Step, while a small diagram with only a few connections usually looks cleanest with Curve.
Combining with data flow
Section titled “Combining with data flow”The third row on this same toolbar, Flow, turns on the animated moving-dots indicator — covered on its own page: Data Flow Animation.