The Inventory
Click Inventory in the ribbon to see the current view as a table: one row per device, with its name, type, hostname, IP address, the zone or network it sits in, role, OS, environment, criticality, owner and location.
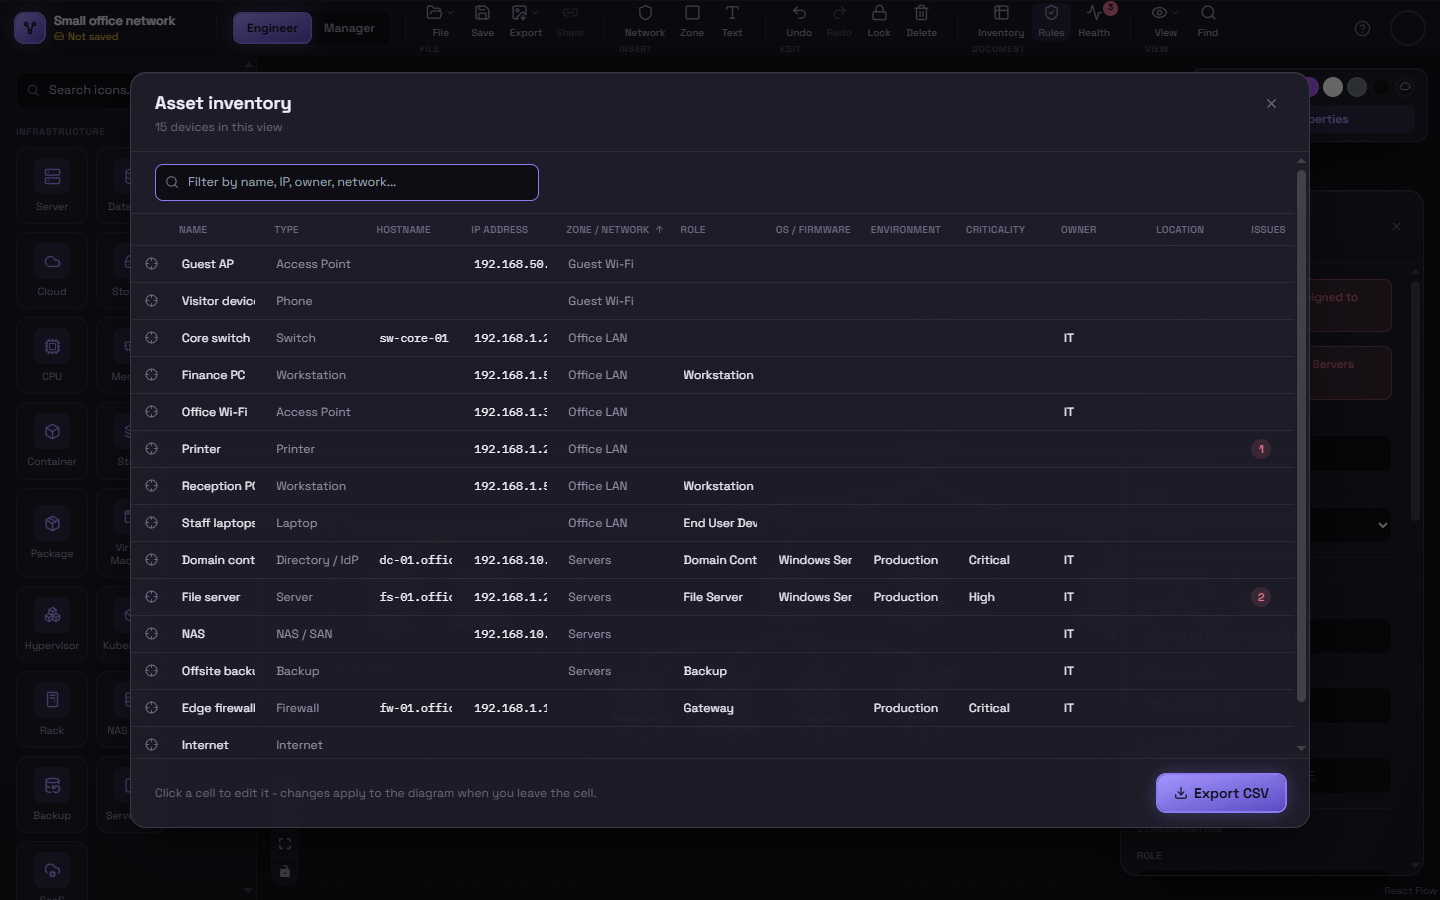
This isn’t a copy of the diagram — it is the diagram, shown another way. There’s nothing to keep in sync.
Finding things
Section titled “Finding things”- Filter — type in the box to narrow the table by anything: part of a name, an IP prefix like
10.0.1, an owner, a network name. - Sort — click a column heading; click again to reverse. IP addresses sort numerically (
.9before.10), criticality sorts by severity, and blanks always go last. - Jump to a device — click the target icon at the start of a row to close the table and centre the canvas on that device.
The Issues column shows how many open findings each device has.
Editing in the table
Section titled “Editing in the table”Click any cell in the Name, Hostname, IP address, Role, OS, Environment, Criticality, Owner or Location columns and type. The change is applied to the diagram when you leave the cell (or press Enter), and can be undone.
This is the fast way to fill in a column across many devices — owners for a whole subnet, say — without opening each device’s Properties panel in turn.
Exporting
Section titled “Exporting”Export CSV downloads what the table is currently showing — so filter first to export just one network. The file includes every device field, including the ones the table doesn’t have room for (MAC address, vendor, serial, management URL, notes, custom fields), plus each device’s connection and issue counts.
The same export is available without opening the table, from Export → Inventory (CSV).